
We drive results. Here's the proof.
What it looks like when search data reaches the people who plan routes.

Appleton International (ATW)
Appleton grew Allegiant service 27.8%.
Most airports talk about demand. ATW proved theirs.
FlyMyAirport® helped ATW win more passengers and earn even more seats.
Passengers and seats both grew
Appleton carried more passengers and offered more seats in every quarter of 2025 than in the same quarter of 2024.
Each bar: growth that quarter in 2025 vs. the same quarter in 2024.
Seats are growing faster each month
Airlines have scheduled more seats at Appleton in every month of 2026 than in the same month of 2025, up 44% by September.
Each bar: scheduled seats that month in 2026 vs. actual seats the same month in 2025.

RouteBuilder™ Advertising
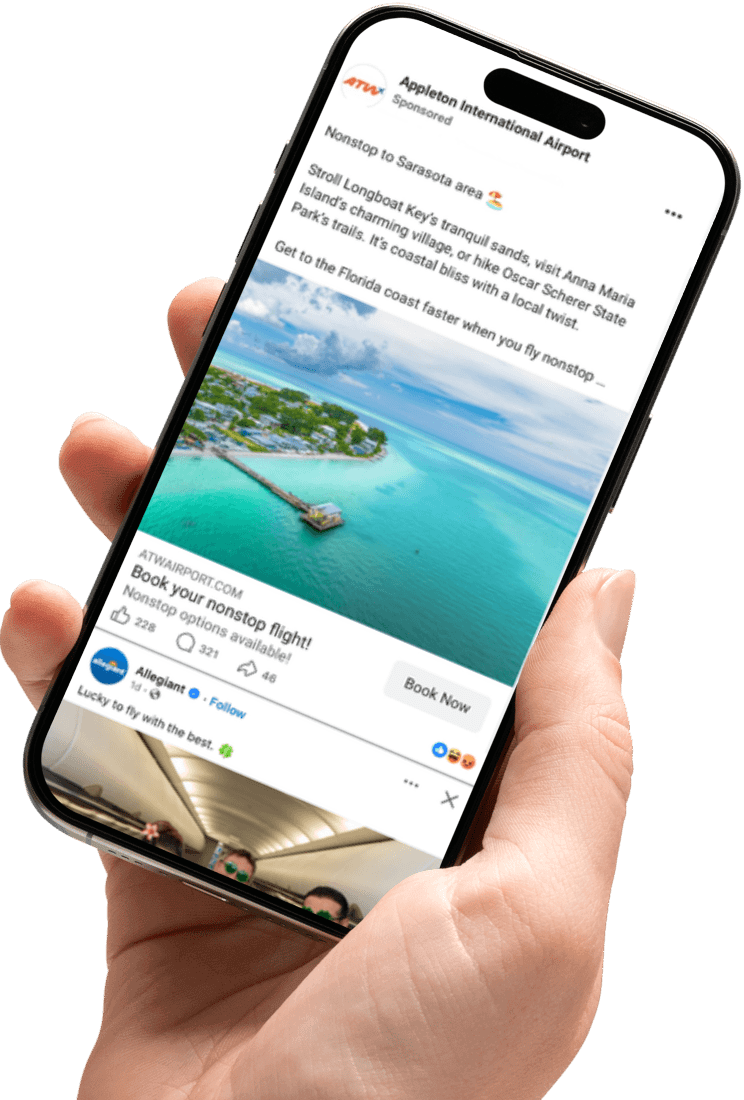
ATW also maximized consideration for key routes with our destination advertising program designed to fill more seats.


Flint Bishop International (FNT)
Flint Bishop drove 25% seat growth.
Want more air service? Show airlines the demand.
Optimizing campaigns on cost per search instead of cost per click put high-intent travelers straight into the FlyMyAirport® booking experience with FNT locked as origin. Demand proven 10 to 12 months out gave airlines the confidence to add capacity: a struggling route was revitalized and a new nonstop to Destin-Fort Walton Beach (VPS) was secured.
+43%
Website visits YTD
87%
Average load factor
+25%
Airline seat capacity

Funnel performance
Efficiency gains
2×
Ad-to-search rate — 4 of 10 clicks become searches
+50%
Return on ad spend
~$1
Cost per paid search
10-12 mo
Demand lead time
Live Oct 2023; ads from Feb 2024. Funnel figures: trailing 12 months vs. prior 12. Seats +25%: 2025 vs. 2024. Load factor: 3+ points above the 2025 national average.
Seven partner airports · Six months
The industry's first proof that co-op advertising works.
Seven spoke markets grew shared routes with one hub airport. Both ends of each route advertised it to their own travelers — and results were measured against real routes with no campaign, not projected or modeled.
7 of 7markets beat the no-campaign benchmark
+31.8%
Average route profitability (SLA-PRASM) growth vs. no-campaign routes
~7,000
Incremental passengers across seven paired routes in six months
~$140K
Estimated incremental hub revenue, at $20 per enplanement
2.2×
Return on the hub's $63,000 program cost — before any airline benefit
Source: Airport One / RouteBuilder 360™ program performance data, six-month term. Hub revenue and return are estimated at $20 revenue per enplanement.
Appleton International (ATW)
Appleton's new Florida routes filled fast.
RouteBuilder™ drove demand for Appleton's new Orlando (MCO) and Fort Myers (RSW) service before the first departure, so more seats were full earlier. Both routes reached load factors above 90% within their first three months.
88%
Average MCO load factor, first four months
92%
MCO peak load factor, its second month
91%
RSW peak load factor, its third month
+3 pts
MCO above the ATW airport-wide average, Jan-Jun 2026
Monthly load factor, new ATW service
Nov
2025
Dec
Jan
2026
Feb
Mar
Apr
May
Jun
Source: U.S. DOT T-100, scheduled passenger service from ATW, Nov 2025-Jun 2026 (run Sept 23, 2026). RSW service began Nov 2025; MCO service began Jan 2026.
Allegiant airports, 12+ months live
Airports using FlyMyAirport® grew faster with Allegiant.
Airports running FlyMyAirport® for twelve months or more saw close to double the seat growth of those that were not.
Onboards, 2025
+14%
+6%
With FlyMyAirport®
Without
Seats, 2025
+17%
+10%
With FlyMyAirport®
Without
Forward seats, May-Oct 2026
With FlyMyAirport®
+1.7%
Without
−0.8%
Schedules shrank at airports without FlyMyAirport
Allegiant airports, G4 only. 2025 U.S. DOT T-100; forward seats May-Oct 2026, DIIO.
Seat growth across FlyMyAirport® airports.
Want numbers like these for your airport?
Every seat starts with a search, and every one of these started with a conversation. Yours can too.
Keep exploring
Full-Funnel Marketing — Explained
What reach, engage and convert actually mean for an airport
By Chris Matthews
Spring Break Starts Earlier Than You Think
Insights from real-time search data
By Hannah Grenke
Turning Real Search Behavior into Projected Demand PDEWs
A new data methodology for air service
By Keegan Coulter